Is Jane Street the biggest firm virtually everyone outside Wall Street has never heard about?
It keeps winning and winning...beating banks and nonbanks at their own game
Bank trading desks are from Mars and nonbank traders are from Venus we are told. Different styles of trading. Different regulation. Different capital commitment.
But Jane Street is challenging this stereotype and, in the process, the competitive landscape in credit trading.
Let’s start with capital. Most nonbank market makers are high-frequency traders. They are thinly capitalized and rarely hold onto positions. Jane Street in its early years was also thinly capitalised with $228m of capital in 2007 just before the financial crisis and even in 2016 this was only a $1bn. But in the last 5 years, the firm has dramatically grown its capital base by $18bn to over $20bn.
This expanded capital base has supported greater balance sheet exposures. From 2013 to the end of 2020 the total value of securities long positions held by Jane Street Capital rose from just under $4bn to $24bn. The greatest share of this was from equities (likely to include not just equity but also fixed-income ETFs that are classified as equities) which increased from $3.9bn to over $14bn. Interestingly corporate bond long positions which were only $57m in 2013 increased to $8.5bn by the end of 2020. They were offsetting short positions so net holdings are a fraction of this, but it illustrates the move of Jane Street beyond ETFs into bank flow credit trading.
Jane Street’s growth exploded in H1 2020 when it was reported to have made $8.4bn in trading revenue and EBITDA of $6.3bn, the latter a 1000% increase yoy. Activity normalised, in the second half to give 2020 trading revenues of $11.4bn and EBITDA of $8bn. Despite lower volatility, the company continued to benefit given it was the dominant market leader in fast-growing bond ETFs and the symbiotic surge in electronic and portfolio trading of corporate bonds.
Following a blockbuster second half of 2023 momentum continues to improve in 2024. The FT reported Jane Street revenues of $4.4bn in Q1 2024, more than double the level it achieved a year prior and up 35% from Q4 2023.
Beating Flow Traders and other nonbank market makers
Two firms that were once direct peers — Jane Street and Flow Traders — are now as far apart as Amazon and Poundland. Jane Street was founded in New York around 1999 and Flow Traders in Amsterdam in 2004 — and for a while, they were seen as major competitors in the burgeoning ETF industry. But slowly the gap got bigger and bigger . . . and bigger. Flow Traders’ revenues are now only 3% of the size of Jane Street, its revenue per employee ratio is only one-tenth of Jane Street and it has a market capitalization that is a mere €680m.
Jane Street’s market leadership position underpinned a virtuous cycle of a flow monster with the best technology and able to attract the best talent from big tech, big banks, and big universities. Flow Traders’ capital base is less than 4% of Jane Street, illustrating a different business model.
With bond ETF trading volumes having doubled in the last 5 years, Jane Street’s traditional strength in this area has positioned itself well and it has leveraged this to expand into corporate bond trading. Flow Traders’ gross long positions in ETFs can be around a quarter of Jane Street’s exposure, while in corporate bonds it is less than 5% of the latter.
At the same time, Jane Street has become an effective wholesaler of flow in both equity ETFs and cash equities with many weaker investment banks even white-labeling and distributing its prices and execution. Jane Street has also come from nowhere to be a sizeable systematic internalizer in European cash equities, a space dominated by XTX Markets and Citadel Securities.
Geography is increasingly destiny. As an American firm, Jane Street has a natural advantage over European players like Flow Traders and Optiver. Europe is only 5% of ETF volumes (albeit a bit larger in revenues) while the Americas is 85-90%. Like its investment banking peers, Flow Traders has struggled to crack the US market.
All of this gives Jane Street real economies of scale. It generates 30-45x more revenue than Flow Traders with 4x as much headcount. Consequently, the former has consistently generated 70% EBITDA margins in recent years while the latter saw net profit collapse to under €60mn in 2023 — what would be a bad week for Jane Street.
Beating the world’s biggest investment bank flow monsters
The symbiotic growth of bond ETFs with electronic and portfolio trading changed the game. Spreads compress massively as trades are sliced into smaller ticket sizes, and distributed through MarketAxess, Tradeweb, and Bloomberg. Banks lost the moat of captive flow around their bilateral block trading business.
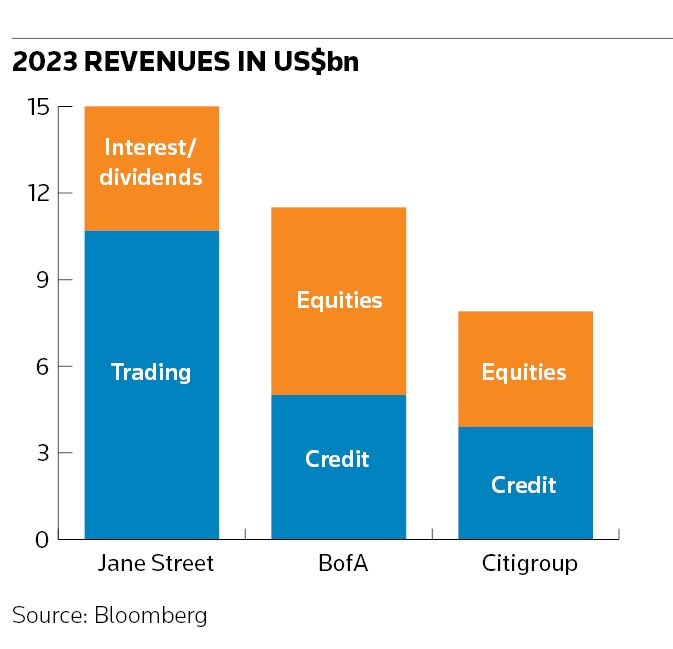
The chart below illustrates Jane’s Street 2023 revenues relative to the respective overlapping businesses at Citigroup and Bank of America, two of the largest markets trading franchises that break out their credit trading revenues from other fixed-income businesses. This gap has only widened further in 2024. Mickey Bhatia, Citi’s head of spread (credit) products recently told IFR “It became more competitive and the bid offers became smaller”.
Citigroup and Bank of America are also two of the only leading banks to break out the capital allocated to only their markets business. At $46bn and $53bn respectively this is much higher than Jane Street, but the former do cover a much wider range of business across rates, foreign exchange, and commodities as well. It is unlikely that any major bank is substantially better capitalized than Jane Street in its ETF and credit trading franchises.
Moreover, although in areas like private credit, nonbank providers are benefiting from regulatory arbitrage, Jane Street is not excessively leveraged. According to Fitch Ratings, balance sheet leverage on March 31st, 2022, was 6.9x well below their benchmark for investment bank trading firms of 15x. It then estimated that this had fallen to 6.2x later that year and in late 2023 and early 2024 this is below 6x. Banks tend to have lots of low-risk derivatives and government bonds on their balance sheet so gross leverage is a crude comparison, but it can’t be said that Jane Street is driving growth through taking on more leverage.
Every major bank trading franchise is investing heavily in playing catch up in ETF trading but their ability to grow in this area appears to have been more than countered by Jane’s Street’s ability to use their existing footprint as a trojan horse into the bread-and-butter credit trading business of banks. The good news for the banks is that very few nonbanks are as sophisticated as Jane Street.
Jane Street culture
Jane Street has a reputation for hiring the best young STEM graduates. As well as the infamous SBF they are known for sponsoring Maths Olympiads. But they are also known for being more of mixture of manual and algorithmic quant trading than many traditional nonbank market markers albeit Citadel Securities has also been expanding their roster of manual quant traders.
The attention of Jane Street to detail has also recently expanded to how their trading floor is set up ranging from the optimal combination of screens on their trading desks to what teams are situated next to each. In a recent podcast, Jane Street’s CTO sat down with Erin Murphy a UX designer they had hired who had worked at NASA’s Jet Propulsion Laboratory building user interfaces for space missions….Signals and Threads
This reminds me very much of the discussions I would see head traders having when I started on the CSFB trading floor in 1998 but with one major difference - Jane’s Street approach is highly data-driven and involves helping engineers discover what their traders really want.


